The pulse height distribution is the variation of the magnitude of the ouput pulses at a constant applied voltage. This variation is caused by the random nature of the electron paths in the channel. The pulse height resolution is defined as the ratio of the full width at half maximum (FWHM of the curve) ΔG of the pulse height distribution to the mean gain Go of the multiplier.
It is typcally < 40 % at a moderate counting rate of 3.000 cps and an applied voltage of 2.5 kV. For the experimenter, the size of the pulse height distribution is not important as long as all pulses lie above the discriminator threshold. More important than the static size of the PHD is its behavior depending on the count rate, as it determines the maximum count rate and therefore the dynamic range of the CEMs.
| PHD = (ΔGFWHM/G0) x 100 % |
The behavior of the PHD, on the other hand, depends upon the wall resistance of the CEM. The higher the wall resistance is, the faster the pulse height distribution broadens. This causes pulses to fall faster under the discriminator threshold and are not counted. In contrast, the pulse height distribution of low-ohm CEMs is broader at lower count rates, but it behaves much more lethargically than in the first case. The result is higher maximal count rates and therefore a higher dynamic range.
| Fig. 5 Trace of CEM output pulses recorded within 2 ms. The different pulse heights can be seen directly and straggle between - 40 mV and - 140 mV |
Fig. 3 shows the behavior of the pulse height distribution, when the count rate is changed at constant applied voltage. With increasing count rate, the PHD becomes wider and moves in the pulse height analyzer towards the left towards low gain. This corresponds to a drop in the Gain vs. Count rate plots in Fig. 6 in Quality Assurance/Maximum count rate.
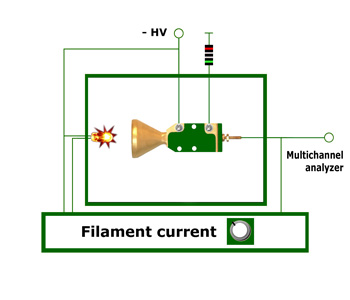
The picture shown in Fig. 6 show the change of the pulse height distribution at a constant count rate but changed applied voltages. The data in the pulse height analyzer (Fig. 6) and in the oscilloscope (Fig. 4) were recorded simultaneously. With increasing applied voltage, the pulse height distribution moved to higher channel numbers in the PHA. This corresponds to larger output pulses, such as can be seen on the oscilloscope pictures.