|
| |
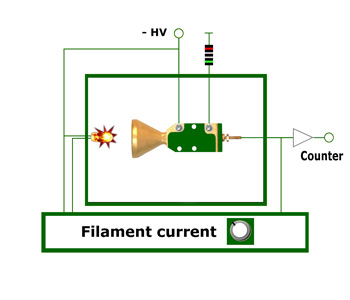
Fig. 1 Diagram for the measurement of the Gain vs. Count rate |
|
|
|
|
|
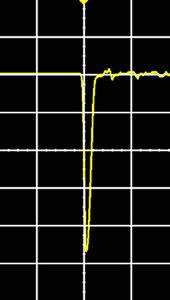
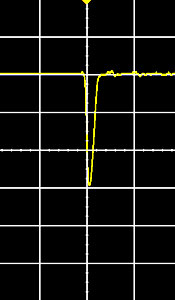
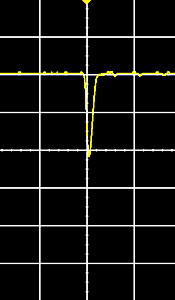
Fig. 2 Oscilloscope pictures taken at an applied voltage of 2300 V. Left: count rate 3 x 10e4 cps, right: count rate 4 x 10e5 cps. Vertical scale is 20 mV
|
| |
|
|
| |
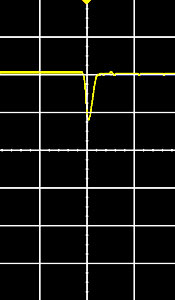
Fig. 3 Oscilloscope pictures taken at the same conditions as in Fig. 2. Left: count rate 7 x 10e5 cps, right: count rate 2 x 10e6 cps. All pictures are averaged over 1024 frames |
| |
| |
|
| |
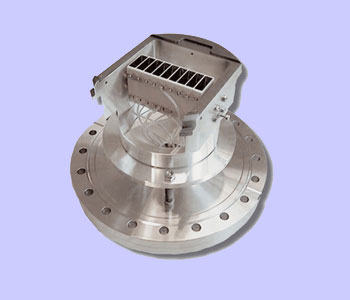
Fig. 4 PHOIBOS SCD (SPECS GmbH)
|
| |
|
|
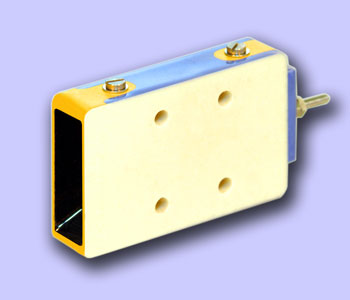
Fig. 5 The KBLA2107-EDR is used in the SPECS PHOIBOS SCD
|
| |
Gain vs. Count rate plot
The maximum possible count rate of a CEM is occassionally an essential component in the conception of a detector system, since it determines the dynamic range of this system. As shown below, it does not only depend upon the CEM but also electronic parameters such as the dead time of the preamplifier and the threshold of the discriminator.
In order to optimally use the entire system, CEM - preamplifier - counter, the setting of the dead time and the discriminator threshold should also be well considered, such as is explained in the chapter entitled Gain Characteristic.
The greatest influence on the maximum count rate of a channel electron multiplier is the wall resistance, which is why we distinguish between Standard CEMs (typically 250 MOhm) and the Extended Dynamic Range CEMs (typically 70 MOhm). If the number of output pulses is increased from a low value and the gain of the CEM is measured, then the gain begins so grow smaller at a certain point. This point and the strength of the following decline of the gain are different for CEMs with very high wall resistance, Standard CEMs and EDR type CEMs, as the figures below show. Here the Gain vs. Count Rate curves for CEMs with 3 different wall resistances was measured. CEMs with a wall resistance of 800 MOhm are mainly required for space experiments in which small counting rates are expected and in which power consumption plays an important role.
Wall resistance 800 MOhm |
Wall resistance 200 MOhm |
Wall resistance 60 MOhm |
| |
|
|
|
|
|
User Report |
|
Courtesy of SPECS GmbH, Berlin |
|
| |
|
|
|
|
| |
|
|
|
|
| |
Maximum count rate of Standard and EDR type CEMs |
|
|
|
|
|
|
| |
The PHOIBOS SCD and a modified EQ 22 electron gun were installed on a UHV system without bakeout (base pressure 2 x 10e-7 mbar). A copper sample was cleaned by sputtering with Ar+ ions. The sample current was measured with a picoamperemeter and a +90 V bias voltage.
|
|
For different beam currents the count rate was measured with the standard PCU 300 detection electronics and the SPECSLAB software in the fixed kinetic energy mode.
In a second experiment the AES low kinetic energy region of the sample was measured with two different currents. |
|
| |
|
|
|
|
| |
|
|
|
|
|
|
|
|
|
| |
|
|
|
|
| |
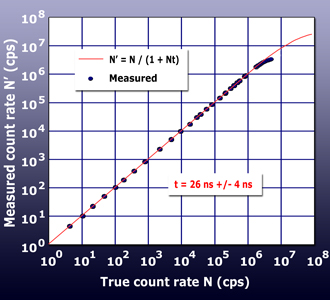
Fig. 1: The count rate N' was measured for different beam currents I. From the low count rate region we have calculated the conversion factor a (N = a x I). |
|
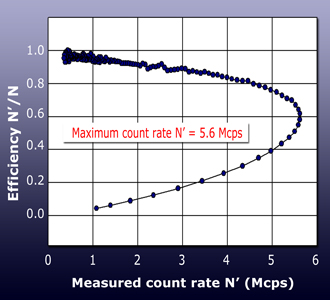
Fig. 2: From a spectral ratio plot of two spectra measured at different beam currents the detector efficiency N'/N was calculated. With increasing count rate the mean gain of the pulse height distribution will decrease. For some critical value the distribution starts to fall below the discriminator threshold. |
|
| |
|
|
|
|
| |
|
|
|
|
| |
|
|
|
|
| |
|
|
|
|
| |
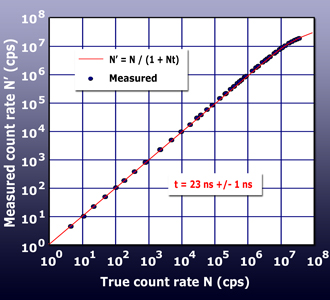
Fig. 3: Linearity plot for the new Extended Dynamic Range CEMs |
|
Fig. 4. Efficiency plot for the new Extended Dynamic Range CEMs. |
|
| |
|
|
|
|

|