| CEM Models / Standard CEMs |  |
| Home | Introduction | CEM Models | CEM Handling | Quality Assurance | Measurement System MEASAR |
|---|
|
||||||
|
Characteristics of Standard CEMs |
Dr. Sjuts Optotechnik GmbH |
||
Rudolf-Wissell-Str. 14, 37079 Goettingen, Germany Tel. + 49 (0) 551 209 95 62, Fax. + 49 (0) 551 209 95 63, Email: sjuts@t-online.de |
||
| User Report | Courtesy of Dr. Herman Batelaan, University of Nebraska-Lincoln, USA |
|||||
| Why electron counting? | ||||||
The demonstration of absence of force for the Aharonov-Bohm effect (Fig. 1) and the Kapitza-Dirac effect (Fig. 2) happened decades after their predictions [1,2]. In these two experiments, the particle detection was done with Dr. Sjuts electron multipliers. |
The required temporal resolution of 1 nanosecond is provided by the Dr. Sjuts detector. Given the need to detect the arrival time of individual electron for the first experiment and the low count rate (0.1/s) for the second experiment, the electron had to be counted.
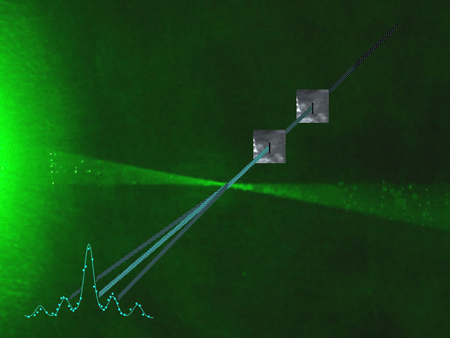
Figure 2 |
|||||
 |
||||||
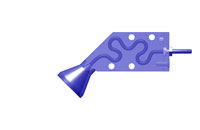
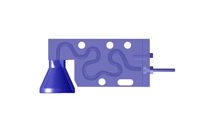
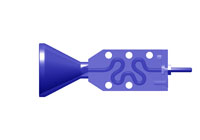
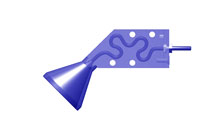
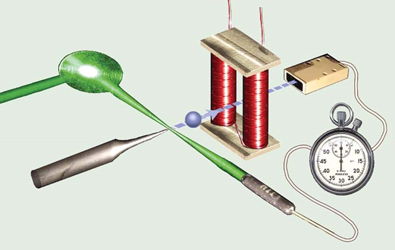
Figure 1. A laser triggers an electron pulse from a sharp needle. The electron pass by magnetized solenoid and even in the presence of a vector potential there is no time delay as measured with a Dr. Sjuts electron multiplier (right top), this means an effect without a force. |
 |
|||||
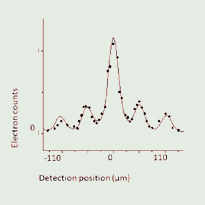
Both experiments called for nanosecond timing, while for the Kapitz-Dirac experiment this had to be combined with a spatial resolution of mircrometers. A narrow metal slit was placed in front of a channel electron multiplier and translated to obtain the spatial resolution. The comparison to a quantum mechanical calculation showed (inset Fig.2) that the detector had a flat response as a function of position; no background subtraction was needed. Most of the time the laser was off (10 nanosecond pulses with a 50 Hz repetition rate), which meant that the signal had to be filtered out of a strong backgrond with coincidence measurement techniques.
|
||||||
|
||||||
A schematic of an electron matter beam (blue) diffracted by the standing wave "grating" of laser beam (green), illustrating that the role of the matter and light are reversed for the Kapitza-Dirac effect |
||||||
| [1] Phys. Rev. Lett. 99, 210401 (2007) | ||||||
| [2] Nature 413, 142-153 (2201) | ||||||